Tallyroom
Bookkeepers clear month-end matching from one review queue, and every suggested match shows its reason.
Sample project. Replace with real work.

Problem
Small accounting firms reconcile hundreds of bank transactions against invoices every month. Tallyroom already suggested matches automatically. Usage data told a strange story: most sessions ended with a spreadsheet export, and the matching was finished somewhere else (sample finding).
Bookkeepers don’t trust matches they can’t check, so they redo the product’s work in spreadsheets and month-end takes days.
Research
I sat with six bookkeepers through a real month-end close, watched how they worked, and looked at export data across the product (sample research for this placeholder project).
I don’t trust a match I can’t see the reason for. If it’s wrong, it’s my name on the books, not the software’s.
- Trust needs a reason. A green tick alone was ignored. A tick with “amount and reference match, date two days apart” was accepted.
- The work is triage. Most transactions are obvious. The skill is in the ten percent that aren’t, and the old table gave all of them the same weight.
- Month-end is interrupted work. People were pulled away constantly, so the screen had to show where they had got to.
User flows
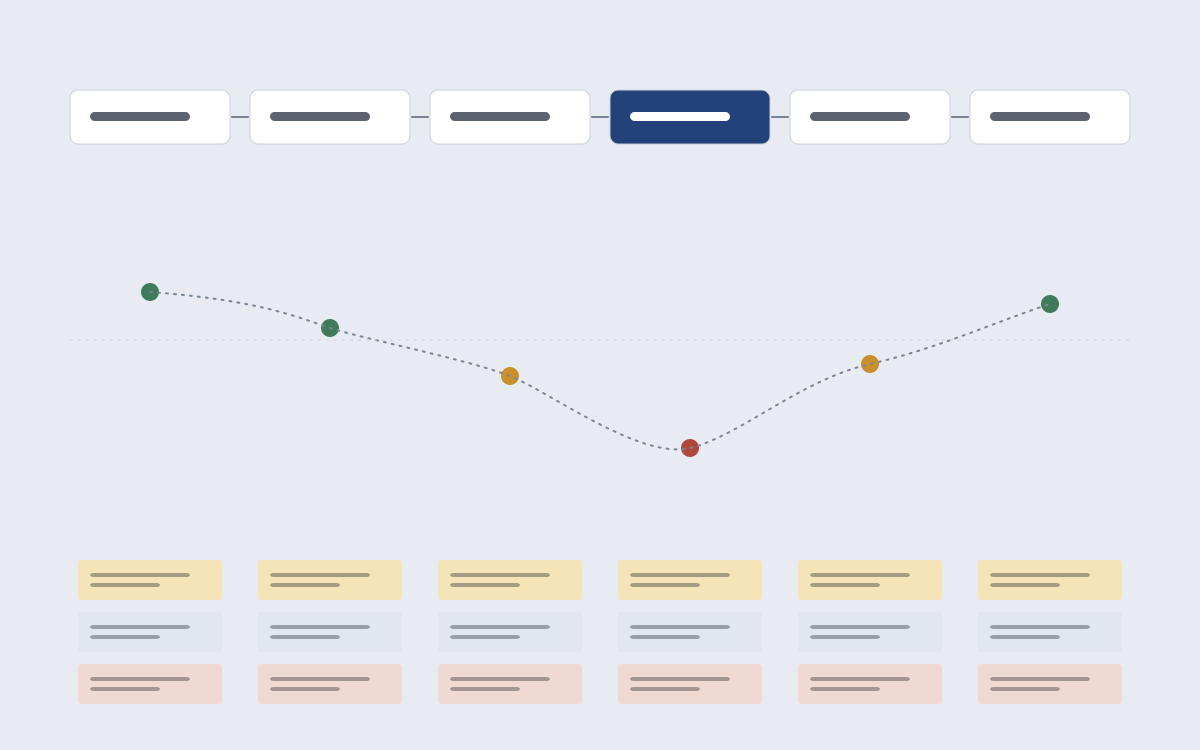
The month’s bank transactions come in, often hundreds of them.
Each transaction is sorted into one of three states: Matched, Needs a look, No match.
Instead of a table of everything, the queue opens on what needs a person, ordered by how much money is at stake.
Obvious matches are accepted in bulk. For the rest, the side panel shows the bank line, the invoice and the reason.
The bookkeeper signs off a month they have actually seen.
Key decisions
Three states instead of a confidence score
Matched, Needs a look, No match. Each state says what to do next.
A 0–100 confidence score on every row, which the data science team preferred.
Trade-off. We hide nuance the model has. In testing, people argued about whether 82 was good enough and then checked everything anyway; three states got a decision (sample).
Show the reason next to every suggested match
One line of reasons on each suggestion: which fields match and which don't.
A clean row with a tick and the detail one click away.
Trade-off. Rows are denser. I tightened the type scale and moved secondary columns into the side panel to pay for the space.
Most of that space was paid for with type. The table uses tabular figures, so amounts line up by digit and a trained eye can scan a column of money without reading it.
The rejected direction was the most-requested feature on the roadmap: one button that reconciles everything automatically. It tested well in a demo and badly with the people accountable for the books: they would not sign off a month they hadn’t seen.

Solution
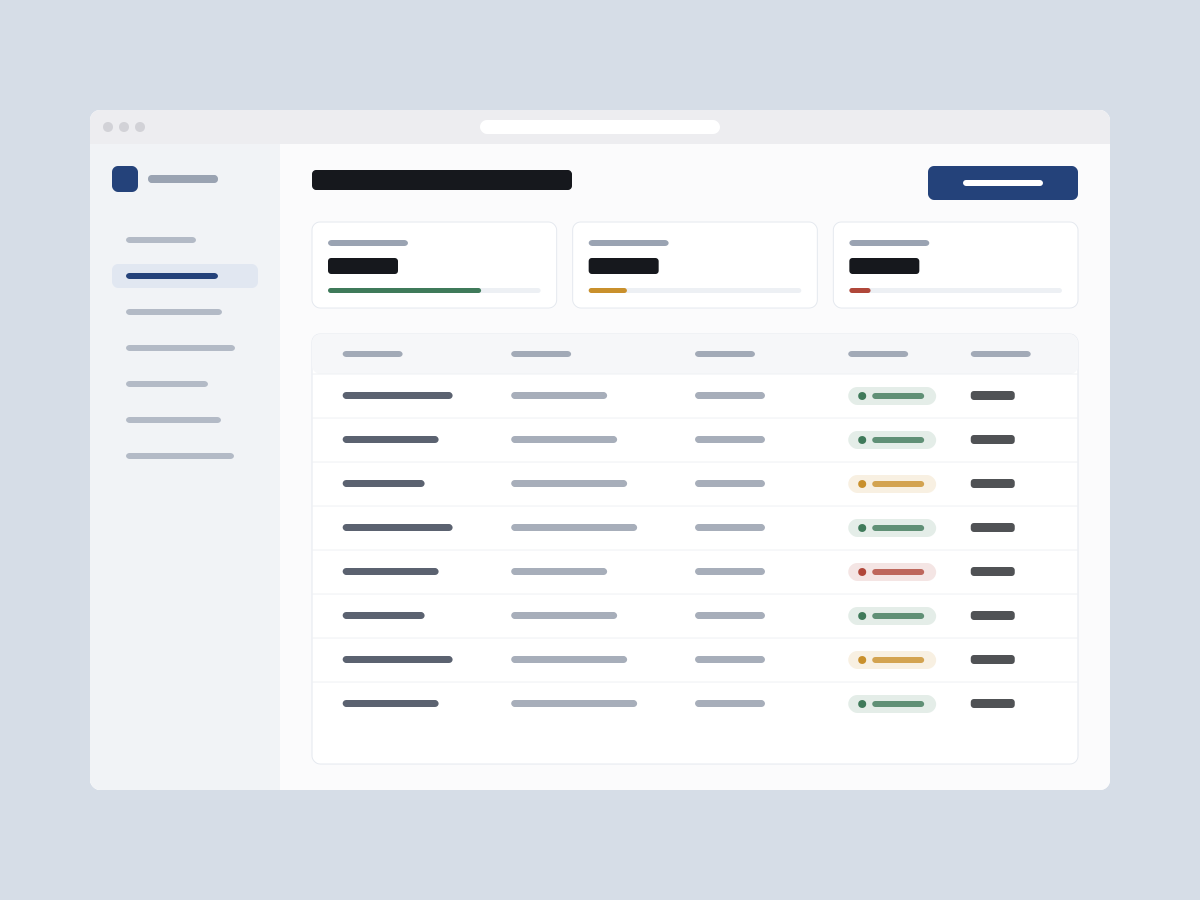
The review queue replaces the old table as the home of month-end. Summary figures at the top show how much is matched, needs a look, or has no match. The side panel puts the bank line and the suggested invoice next to each other, with the reason written out, and accepting is one keystroke.
I built the queue as a coded prototype with Claude Code so we could test it with real exported data instead of tidy Figma rows. Messy data broke two of my layouts in the first hour, which is exactly why I did it.
Outcome
Placeholder numbers until real ones are supplied.
- Spreadsheet exports per close fell by around 60% in the beta, e.g. from 7 in 10 sessions to 3 in 10 (sample).
- Beta firms closed the month a day earlier on average (sample).
- Support tickets about “wrong matches” became tickets about specific edge cases, which the data team could act on (sample).
What I’d do next
- A full keyboard flow. Power users asked for it. I designed the shortcuts but they didn’t make the release.
- An audit trail that shows who accepted what, for firms with more than one bookkeeper.
- Measure trust over time. Do people start accepting in bulk once they’ve seen the reasons for a few months? That would tell us whether the reasons can get quieter.